
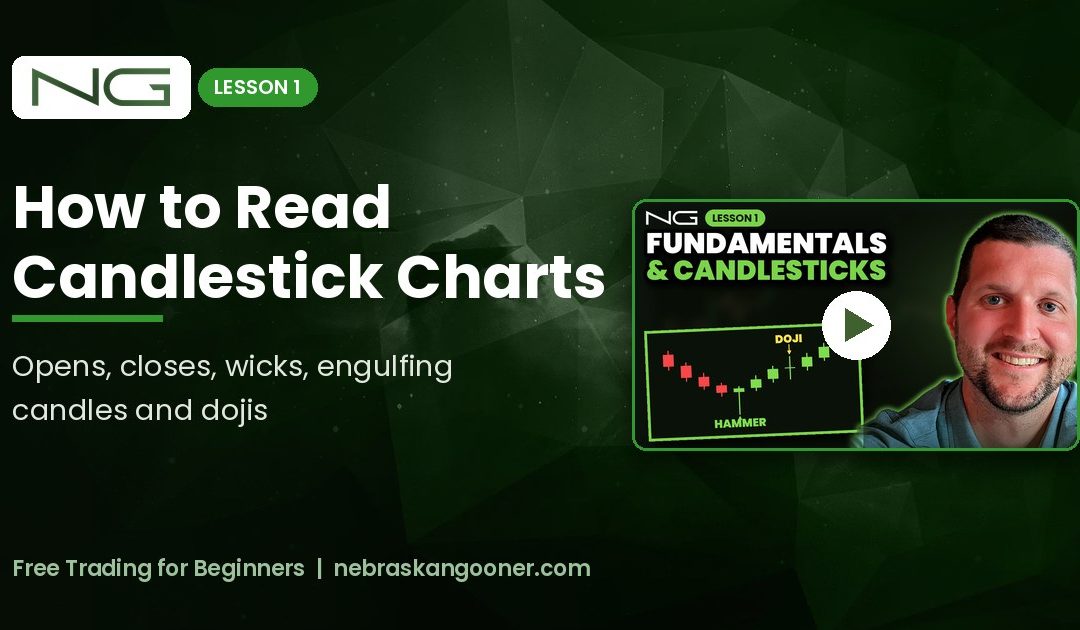
When a friend of mine wanted to learn trading, the first thing we went through was candlesticks. Not indicators, just candles. Every chart is built out of them, so if you can read a candle you can start to read what buyers and sellers are doing. This is the written version of Lesson 1 of my free beginner series, and the full stream is below.
What one candle tells you
Every candle covers one block of time. On a 1-hour chart, each candle opens at the top of the hour and closes at the next hour. On a daily chart, each candle is one day. Each candle has four prices:
- Open: the price when the candle started.
- High: the highest price traded during that time.
- Low: the lowest price traded during that time.
- Close: the price when the time ran out and the candle locked in.
A green candle closed higher than it opened, so the open is at the bottom of the body. A red candle closed lower than it opened, so the open is at the top. On a 1-minute chart you can watch a candle start green, flip red and flip back before it closes. Once it closes, it is locked in.
Wicks: everything that happened outside the body
The thin lines above and below the body are wicks. They show where price went during the candle but did not stay. A long lower wick means price dropped, buyers stepped in and pushed it back up before the close. Lower wicks stacking up in one area tell me buyers keep defending it. Upper wicks are the opposite: buyers pushed up and sellers said no.
Wait for the close
This is the most important habit I can give a new trader. A candle that is halfway through its time frame is not finished. I have watched a big green hourly candle look ready to rocket and close half that size with a long upper wick. Wicks can go anywhere they want. The close is what the market actually agreed on.
My own rule is two closes. If price closes below a level once and the next candle closes back above it, I treat that as a fake out. I want two closes beyond a line before I count it.
Which time frame should a beginner use?
Start on the daily and the 4-hour. I would not go below the 4-hour when you are starting out. On a 1-minute chart, one big market order can change how a candle looks. A 4-hour candle has four hours of buying and selling inside it, so its close carries a lot more meaning.
Candlestick patterns I actually use
These are the ones worth learning first:
- Bullish engulfing: a green candle whose body and wicks completely cover the red candle before it. Buyers took back everything sellers did. Technically it has to engulf both wicks too.
- Bearish engulfing: the same thing in reverse, a red candle covering the green one before it.
- Hammer and dragonfly doji: a small body with a long lower wick, usually after a drop. The bottom of that wick is the line I do not want to see price close below.
- Shooting star or tombstone doji: a long upper wick near the top of a move. Buyers pushed up, sellers closed it back down.
- Evening star and morning star: a rejection, a small indecision candle, then a big candle the other way. The evening star is one of my favorite patterns on lower time frames.
- Doji or spinning top: a thin candle where price barely moved. That is market indecision. The next candle is what gives it meaning.
Location matters. A bullish engulfing at the bottom of a move, right at support, carries much more weight than one at the top of a run. A bearish engulfing means more at the top. Volume matters too. If a shooting star prints on the highest volume in the area, the market cared about it. If it prints on almost no volume, I do not give it much weight. And a signal can be invalidated: if price closes back above the high of a shooting star, that rejection no longer counts.
Double tops and double bottoms
A double top is price hitting the same area twice and getting rejected, so it looks like an M. I draw it off the candle closes, not the wicks. It is not confirmed until price closes below the low point in the middle of the M. Once it does, I measure the distance from the top to that middle low and project it down from the break. That is the technical target. Price does not always reach it.
Watch the volume on the second top. Lower volume on the second push means fewer buyers are interested and it is more likely to fail. High volume on the second push means it is more likely to break through. Double bottoms are the same idea flipped upside down.
The newbie stop loss
Here is one that has happened to me and to everyone. You buy a hammer and put your stop right below the wick because that is the obvious spot. Price dips just below it, stops you out, and then goes up without you. I call that the newbie stop. These days I pick where I think my stop should be, then move it a bit lower than the obvious spot, and make my position smaller so my risk stays the same.
Manage your risk before anything else
Reading candles will not save you if one bad trade can take half your account. Learn how much you are risking before every trade. I wrote a whole post on that: Crypto Risk Management for Beginners. Next in the series is Support and Resistance for Beginners.
Keep learning
All of my free lessons, including the #TAtip chart breakdowns from X, are on the Free Content page. The full Trading for Beginners playlist and my other videos are on the Videos page.
If you want to see how I put this into practice, the Crypto Portfolio Tracker is my private Telegram group where I post my entries and exits, stop losses and market updates in text. It is there to learn from, not a promise of results.
Not financial advice. This post is for educational purposes only. Trading crypto is risky and you can lose some or all of your money. Do your own research and make your own decisions.