
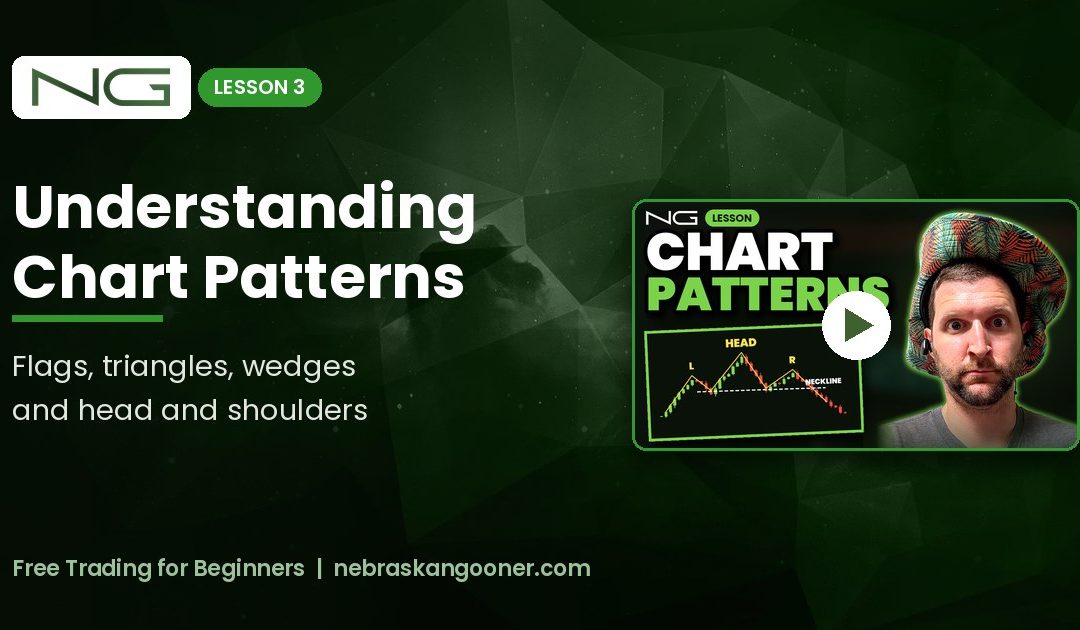
Chart patterns are usually the first thing new traders get excited about. The problem is that a chart can show you something that looks like a pattern and then trap everyone who bought the breakout. This lesson is about telling the difference. The full live lesson is below.
Every pattern has a measured move
The nice thing about chart patterns is that they give you a target. I call it the technical target or the measured target. Take a bull flag. The big move up is the flagpole. Then price drifts sideways or down in a small channel, which is the flag. When it breaks out, you measure the height of the flagpole and add it to the breakout point.
Say the flagpole runs from $1 to $3, so it is $2 tall. If price breaks out of the flag at about $2.80, the measured target is around $4.80. Price does not always get there, but that is the level the pattern points to. I also check whether there is a resistance above that lines up with the target. When two things agree, I like the setup a lot more.
Bull flags and bull pennants
A bull flag is a small channel after a strong move up. A bull pennant is a small triangle after a strong move up. In my opinion they are basically the same thing with the same target.
How I confirm a breakout
- A candle close outside the pattern. A candle that pokes above the trend line and closes back inside does not count. On a 30-minute chart that means waiting for the candle to finish.
- High volume on the breakout. This is the biggest one. A high volume breakout means a lot of buyers showed up and took out the sellers at that level.
- A low volume pullback. In a perfect world, the next candle is a small red one on low volume. Nobody is really selling, people are just waiting to reload.
- An entry on the retest with a tight stop. Buying the retest lets me keep my stop close, so I can risk a small amount relative to the distance to the target.
You do not need to sit and stare at the chart waiting for the close. Set an alert above the trend line and walk away. If the alert fires, come back and see what the candle did. That keeps you from talking yourself into a trade before the pattern is confirmed.
Continuation patterns vs reversal patterns
Continuation patterns usually break in the same direction price was moving when it went into them. Reversal patterns usually break the other way. I say usually because none of these work every time. You have to wait for the breakout.
- Ascending triangle: a flat resistance on top and higher lows underneath. One of my favorite bullish patterns. Every dip gets bought sooner because buyers keep moving their bids up, and eventually the sellers at resistance run out. The target is the height of the triangle added to the breakout.
- Symmetrical triangle: price goes up into it, chops inside it, and is expected to continue out the same way it came in. If it came in from below, I watch for a break up.
- Descending triangle: usually continuation lower.
- Falling wedge: price falls in a channel that gets tighter, usually on falling sell volume, then breaks out. Best when the breakout candle has the highest volume in the area. At the top of a move the same shape is a rising wedge, and it usually breaks down.
- Cup and handle: a rounded bottom, a small pullback, then a break of the resistance at the rim.
Inverse head and shoulders
Everyone loves an inverse head and shoulders, and half the time they do not work out. You have a left shoulder, a lower low for the head, then a right shoulder, all bouncing to the same neckline. The neckline can be flat or slanted. The target is the distance from the head to the neckline, added to the breakout.
Two things I watch. First, in my experience the pattern works out more often when the right shoulder bottoms somewhere between the left shoulder and the head. Second, the breakout volume. Back around 2018 there was an inverse head and shoulders on Bitcoin and everybody on Twitter was calling for a big move up. The breakout came on declining volume, nobody was buying, and it sold off. That is exactly how buyers get trapped.
Only local volume matters
When I say high volume, I mean compared to the candles around it. Volume from months ago does not matter for this breakout. You want the breakout candle to stand out against the volume inside the pattern.
Taking the target
When price reaches my measured target, I usually take it. That was the setup, and once the setup has played out I do not have anything else to go on. If I still like the chart, I can always look to buy back on a pullback.
The three things to check
- Is the pattern valid? Do not force it. It is easy to make up patterns on your own chart.
- Is it a continuation or a reversal pattern, and does it fit where price came from?
- What did the volume do inside the pattern, and was the breakout on high volume?
One last tip: look at the chart yourself before you read what people are posting on X. If you read everyone’s opinion first, your mind is made up before you even pull up the chart. If you have not done the earlier lessons yet, start with candlesticks and support and resistance, because every pattern here is built from them.
Keep learning
All of my free lessons, including the #TAtip chart breakdowns from X, are on the Free Content page. The full Trading for Beginners playlist and my other videos are on the Videos page.
If you want to see how I put this into practice, the Crypto Portfolio Tracker is my private Telegram group where I post my entries and exits, stop losses and market updates in text. It is there to learn from, not a promise of results.
Not financial advice. This post is for educational purposes only. Trading crypto is risky and you can lose some or all of your money. Do your own research and make your own decisions.